iPhone 6 Eye Tracking and the FOVIO Eye Tracker

iPhone 6

Scene Camera Data Collection – Mobile / Tablet Example

Testing on a monitor, testing with a projector, testing on a laptop, a Command and Control Station, a TV… the list goes on. Where ever a person meets machine, there is a way that eye tracking can be employed. As new interfaces and devices are released, eye tracking must evolve to ensure that it can be used easily with those devices.

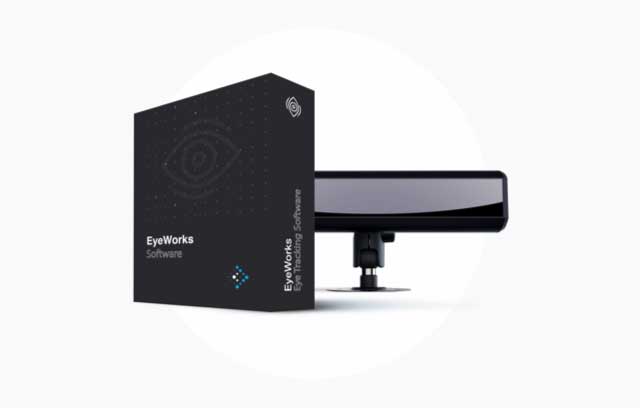
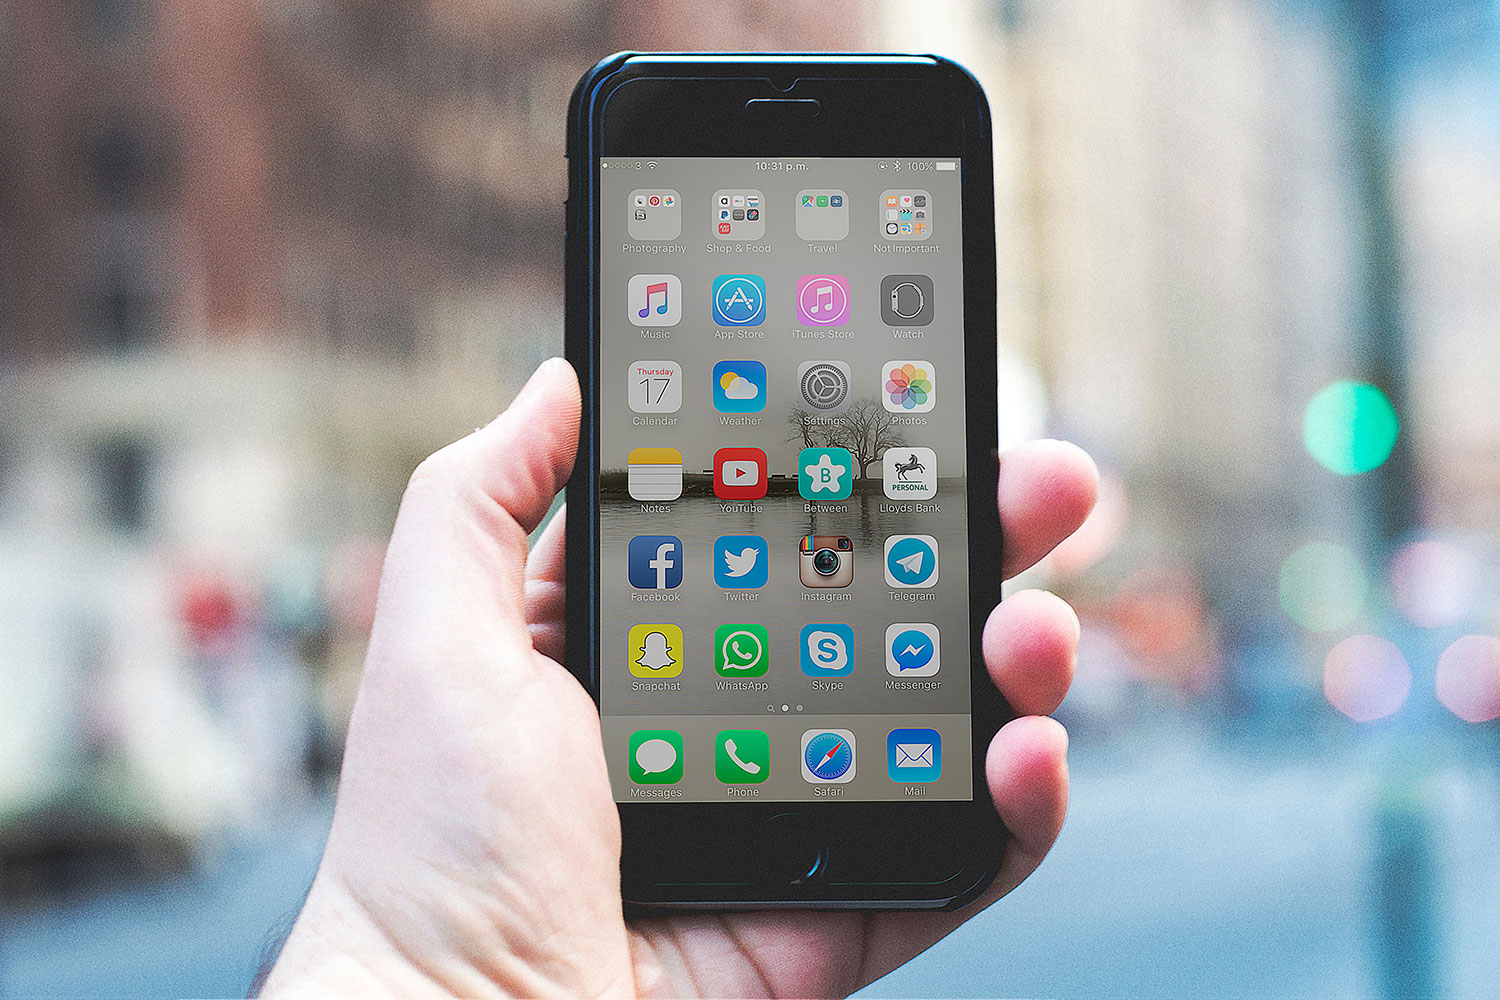
The latest such device was released yesterday, and that’s when mine turned up in the mail – I am of course referring to the much anticipated iPhone 6. Here at EyeTracking, we have many customers that use our EyeWorks software to test mobile apps on a variety of devices. We ourselves, run usability services (using EyeWorks or course), for a range of companies testing mobile apps. As we had an iPhone 6 in hand, we thought we should perform a quick test to ensure that all is working well between EyeWorks and the latest top end phone on the market.  

For those that have not used the EyeWorks Scene Camera Module yet, it is the most easy to use and powerful scene camera solution on the market. We will get more into this in a future blog. Just to make things more interesting, we decided to use the newest eye tracker on the market –the much talked about FOVIO system from Seeing Machines. The first production system of FOVIO only started shipping to the research community this week too, so it seemed only too fitting to use it for this test.

Setup took around about 3 minutes, and we recorded simultaneous and synchronized high-definition videos of the iPhone 6 screen and Picture-in-Picture view of the subject’s hands. There is no geometry configuration needed, just click start, calibrate four points and everything else is running.

Click the embedded clip below to view the raw unedited video from our test. We’ll be sure to post more in the near future, so be sure to check back often and subscribe to our YouTube channel.

Contact our sales team if you are interested in learning more about EyeWorks or any of our other products and services.

Featured image from Unsplash.

Even Eye Trackers Have Blind Spots

Blind spots

“To the man with a hammer, everything looks like a nail.”

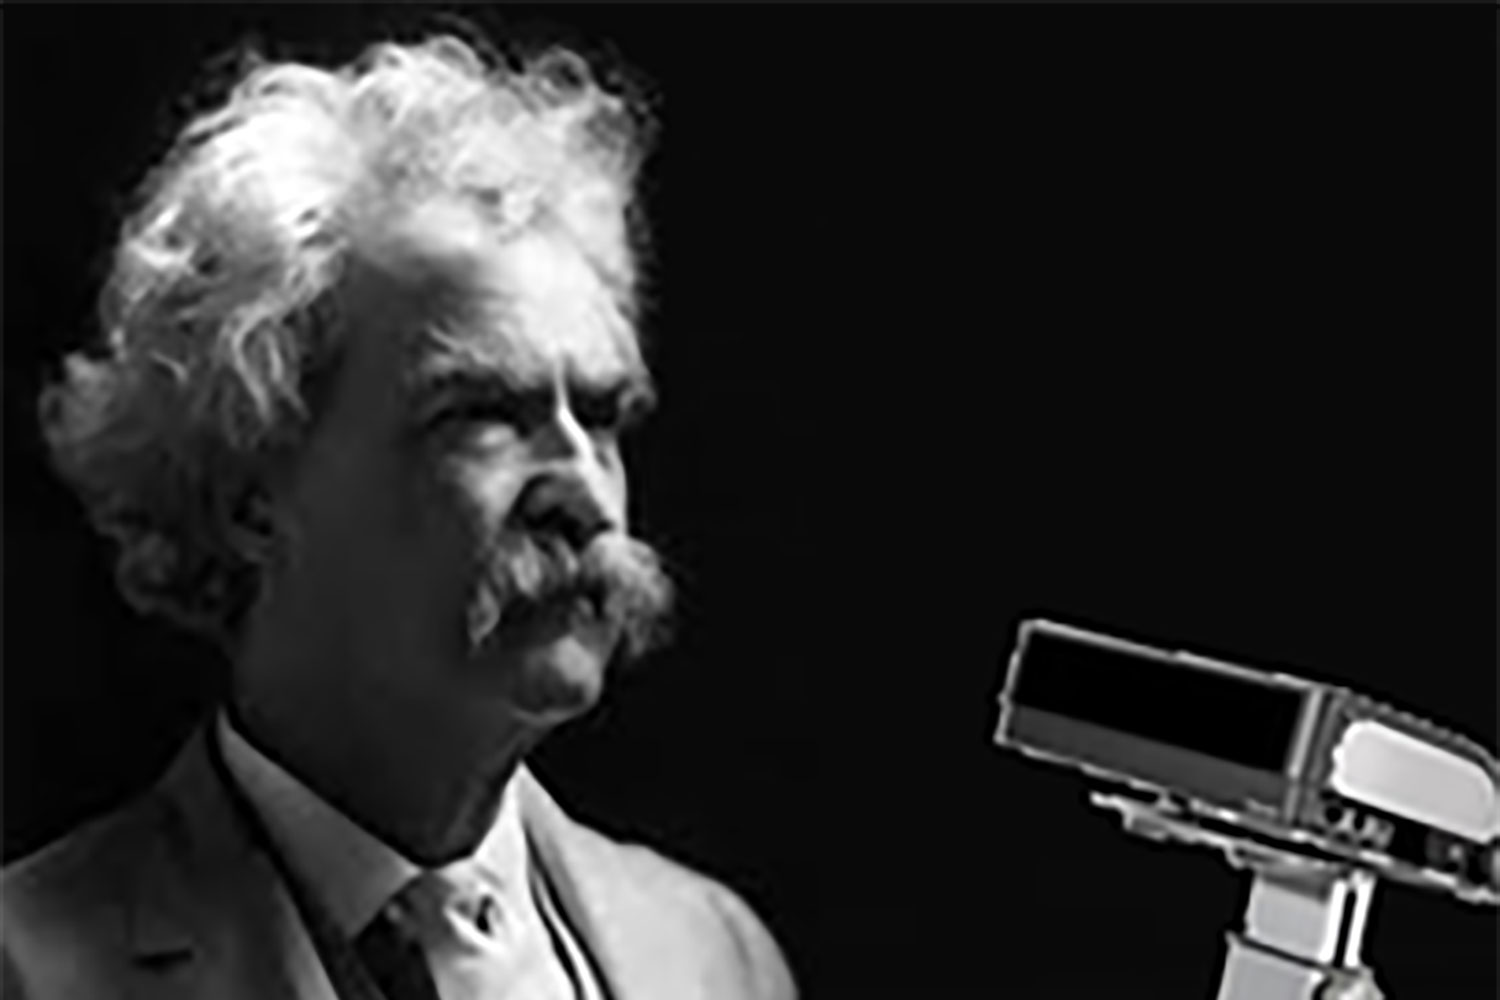
The origins of the preceding quotation are unclear – most likely Kaplan or Maslow, but some argue that Mark Twain said it first. No matter the author, this analogy is apt to describe a current trend in our industry. After roughly a half-century of amazing technological advancements and staggering feats of R&D, eye tracking researchers have created some extremely useful hammers. We have hammers that measure every fixation, saccade and flicker of your pupil. We have hammers that sit on your desk and hammers that rest unobtrusively on the bridge of your nose. We have hammers that can track the eye of pretty much anyone pretty much anywhere doing pretty much anything. I am referring, of course, to our eye tracking hardware systems, which seamlessly translate raw physiology into accurate visual behavior data. Regardless of the source of this well-worn quote, the point can be easily applied to our own high-tech tools.

Eye tracking researchers must resist the temptation to approach every study objective exclusively with eye tracking. Although there is a treasure trove of valuable information available through this methodology, there are many questions that analysis of visual behavior alone simply cannot answer. Eye tracking cannot tell you for certain which item a shopper will purchase. It provides no means of divining click or scrolling data. Most glaringly, there is no configuration of cameras, software and infrared lights capable of capturing the thoughts, expectations and perceptions of the consumer. When planning a research study, it is important to ask yourself the following two questions: Which of my objectives can be addressed by eye tracking? And what other methodologies might I employ to fill in the blanks?

This may seem like common sense, and yet the reach of eye tracking is sometimes overstated by its practitioners. For example in the field of web usability, there are researchers who suggest that heat maps and gaze plots will tell you virtually everything you need to know about usability. Obviously we agree that the eye of the user is an indispensable resource for answering a great many questions, but we only recommend it as a standalone approach when the goal of the research is extremely simple. In addition to eye tracking, any comprehensive evaluation must include analysis of click patterns, pages viewed, time on page, usability errors and scrolling. Websites are not static test stimuli; they are dynamic multilayered interfaces, which cannot be assessed without considering visual and navigational behavior.

Perhaps even more critically, there is the subjective component. Everyone knows that analyzing qualitative data can be somewhat messy. That doesn’t mean it isn’t useful. In our experience the best way to understand the implications of eye and click data is to ask the user to explain it in an eye tracking-enhanced post-testing interview, in which the eye movements of the user serve as a powerful memory cue. A gaze plot will tell you exactly what he/she looked at during a given task, but unless you ask ‘why,’ you can only guess at underlying motivations. Yes, interview data can be unreliable. Yes, the process can be inefficient and the data difficult to quantify. However, if you ask the right questions and interpret the answers carefully, your understanding of the user experience will undoubtedly be enriched by your qualitative efforts.

Questionnaires, physiological sensors, task success metrics – there are too many other methods to mention, most of which compliment eye tracking nicely (and are supported by EyeWorks). The best approach is one that pairs each research question with the appropriate research technique, for example…

  • How quickly do users notice the left navigation? Utilize eye tracking.
  • How often do users click links in the left navigation? Track navigational behavior.
  • Do users like how the left navigation is organized? Interview the user after the session.

Eye tracking is an unparalleled research methodology with applications in a wide variety of different fields. Nevertheless, that doesn’t mean it must stand alone. Don’t limit yourself. Use any and all tools necessary to meet the specific objectives of your study. If you can do that, there’s a good chance your results will hit the nail on the head.

EyeWorks™: Dynamic Region Analysis

Dynamic Region Analysis

There’s a lot to like about EyeWorks™. Its unique brand of flexible efficacy makes it an ideal software solution for eye tracking professionals in a variety of academic, applied and marketing fields. To put it simply, EyeWorks™ IS the collective expertise of EyeTracking, Inc., refined and packaged for researchers everywhere. In the coming months we will highlight a few unique features of EyeWorks™ in the EyeTracking Blog.

Dynamic Region Analysis (Patent Pending)

All good science must quantify results. Eye tracking research is no exception, be it academic, applied, marketing or any other discipline. Unless you have an objective way to evaluate the precise activity of the eye, there is little value in collecting such data. Thus, most eye tracking software offers the ability to draw regions (or AOIs, if you like) as a way to quantify the number and timing of data points within any static area. In other words, if you want to know how long the user of your training software spends viewing the dashboard, or when your website user sees the navigation, or how many eyes run across your magazine ad, you can simply draw the shape and let the software generate the results. This is quite useful, but there’s a limitation (hint: it’s underlined and bolded above). Yes, the operative word is static. Most eye tracking analysis software allows you to draw regions for static content only. That means no flash, no dropdowns, no mobile features of a simulation, no video, no objects moving in a scene camera view. As you can imagine, this seriously inhibits the ability of the researcher to quantify the results of any study of dynamic content.

…Unless that researcher is using EyeWorks, a software platform that does not limit regions to the static variety. Dynamic Region Analysis allows you to build regions that change shape, regions that move closer and farther away, regions that disappear and reappear. Generally speaking, any region that is visible at any time during your testing session can be tracked. This patent-pending feature has been part of EyeWorks for the past five years, and we’ve used it in analysis of video games, websites, television, simulators, advertisements, package design and sponsorship research. Because of EyeWorks, the results of these dynamic content studies include more than just approximations of viewing behavior and subjective counting of visual hits; they include detailed statistical analysis of precise eye activity. Our clients appreciate this distinction.

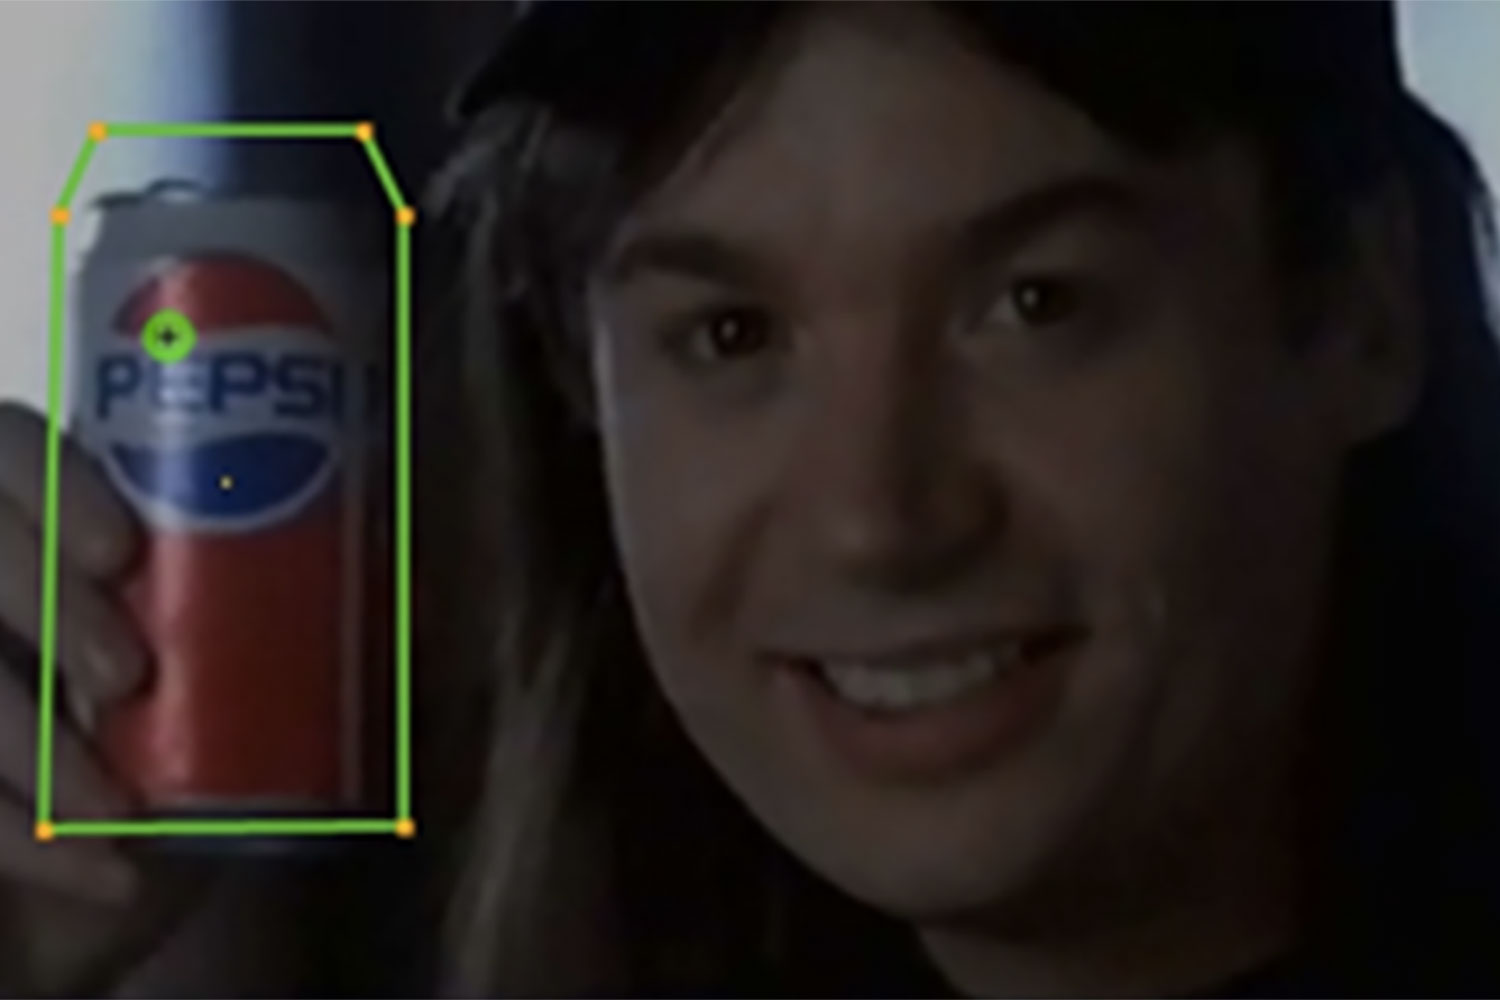
Here’s a video in case you are having trouble visualizing (so to speak) dynamic regions. We’ve taken a very subtle product placement scene from a film, and used EyeWorks’ Dynamic Region Analysis to identify the hidden advertising (outlined in green). In a study of this content, these regions would allow us to analyze precisely (1) when each product was seen, (2) how many viewers saw it and (3) how long they spend looking it. Click the embedded clip below and watch the dynamic regions in action.

This is yet another example of an area where other eye tracking software says “No Way,” and EyeWorks says “Way!” Contact our sales team if you are interested in learning more about EyeWorks or any of our other products and services.

Two Approaches to CPG Testing: Digital Images vs. Actual Packages

CPG testing

Package design is the most challenging form of advertising. It lacks the storyline of a commercial, the vastness of a billboard, the dynamics of an online ad. The package is forced to deliver its message non-verbally with static content on minimal space while sharing the spotlight with every competitor in the category. From a marketing perspective, this isn’t an ideal situation, especially if you consider the fact that the package offers a unique chance to speak directly to consumers at the very moment that they make their purchase decision. It’s a golden opportunity, and yet a cluttered environment and mediocre medium make it difficult to take advantage. The struggle to STAND OUT on the shelf is the primary reason that eye tracking research on CPG has flourished in recent years. Retailers realize that understanding visibility is the key to gauging the effectiveness of a given package design.

There are two approaches to testing packages using eye tracking technology, both of which EyeTracking, Inc. has practiced extensively over the past decade. From study design through data analysis, these approaches are quite different. Before beginning a project, we believe that it’s important for clients to appreciate the benefits and drawbacks of each one.

Testing Digital Images of Packages

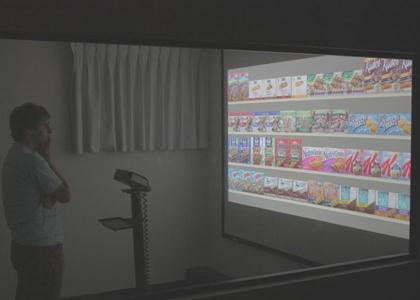
The Process: The first step is to generate electronic images of your target materials. This includes the product/s that you will be testing along with any alternate versions and competitors to be included on your virtual shelf sets. Once the images have been finalized, a script is created (often automated) to guide participants through the interaction. A high-definition projector is used to show all images, instructions and questions within the script, and an eye tracker (remote or glasses) is used to collect data during each session.

The Benefits: If you’re looking for flexibility and depth of analysis, this is the best approach for you. The automated nature of presentation allows you to easily randomize shelf placements, present prototypes that have not yet been produced and ensure that every participant views the exact same packages from the exact same vantage point. To put it simply, you are in control of your research – which package versions are shown, where they are shown and for how long. Because of this control, the data are more conducive to thorough analysis, including accurate assessments of (a) time until the target package is seen, (b)percentage of attention devoted to the package, (c) number of repeat looks at the package, (d) attention to specific package elements, (e) total time on shelf and many others. Additionally, the quality of graphic and video outputs is better when using this approach.

The Drawbacks: The problem with not testing real packages is that you’re not testing real packages. As convincing as your projected images may be, they cannot be picked up, flipped around and scrutinized as they might be in the store. Because of this limitation, it becomes especially important that other components of your research are as realistic as possible, for example the quality of images, projection, instructions and sample tested. When these study details are managed successfully, testing projected images is an extremely valuable approach that can provide a real competitive advantage.

Testing Actual Packages on a Shelf

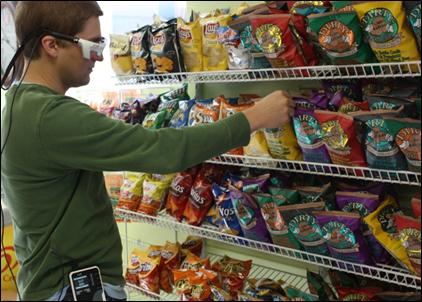
The Process: With this approach, you may either test in an actual store or in a package testing lab with a realistic shelf of products. Instructions to participants are typically given verbally, and they may include prompts that allow the participant to physically interact with the package/s. A mobile eye tracker (typically glasses or headset) is used to collect data during each session. In some cases, a set of IR markers is used to define the calibrated space and targeted packages (recommended).

The Benefits: The main benefit of this approach is realism. You are testing actual products on an actual shelf, maybe even in an actual storeParticipants are free to walk back and forth down the aisle. They may pick up a package to see how heavy it is or look at the side panel to find nutritional information. It isn’t hard to see how this is a big advantage. No matter what discipline of research you’re talking about, the most realistic testing scenarios usually produce the most generalizable results.

The Drawbacks: The cost of realistic data collection is labor-intensive analysis. When testing actual packages, you don’t have a single static shelf image to analyze; you have thousands of frames of video that change as each participant moves. In order to generate precise visibility results, the targeted packages need to be accounted for in each of those frames, which can be time consuming and expensive. Alternatively, this approach can be used as a qualitative method. Skip the detailed analysis, and instead use the eye data as a directional tool. Your results may not be statistically conclusive, but you’ll be getting a rare opportunity to see exactly what your customer sees in a real shopping environment. Depending on the purpose of your study, that may be every bit as informative as a fine-grained assessment of specific visual behaviors.

So which approach is the best approach? As far as we’re concerned, when executed properly they’re both enormously useful in evaluating CPG effectiveness. Your research objectives will dictate which approach is most suitable for your study.

Featured image from Unsplash.

Advertising Your Way through the Data Filter

Advertising

For better or worse, as citizens of the modern world we are inundated with information everywhere we go. At home, at work, in the car, plane or subway, it’s often difficult to disconnect because the news of the day is always at our fingertips and the billboard is ever-present within our field of view. Simply put, it’s a lot to take in. How on earth do we keep it all straight? How do we maintain order with all of this information piling up? Well, the trick is not to let it all pile up. Basically, just ignore that which is not relevant. The 21st century brain makes use of a sophisticated data filter to accomplish this task. It allows us to focus despite all the noise, to live our lives without being completely overwhelmed by the obligation to process every single sight and sound that we encounter. We’d go crazy with data overload if not for this handy adaptation. On the other hand, it does tend to make life more difficult for advertisers.

There is no doubt that Ad Avoidance is on the rise. As laptops, mobiles and tablets are gripped tighter and tighter, consumers devote less and less attention to the commercials on the TV screen. As online ads are recognized more quickly, users learn to ignore them before their message can be communicated. As entertainment shifts from broadcast to narrowcast, we all grow less tolerant of information that we have not actively chosen. These are necessary strategies. With so much data assaulting our senses, something has to be excluded, and for a growing number of people classified as ad avoiders, the choice is a no-brainer

Because of this, we are forced to question our preconceived notions about advertising effectiveness. For example, you may market your product on the inside front cover of the most popular magazine in the country, but that doesn’t tell you anything about how many people actually notice it. Some will avoid looking at that page altogether. Others will scan across it without processing any of the images, copy or design elements that you spent so much time crafting. So how do you ever really know if it gets through the consumer data filter? There is only one method of advertising evaluation that is capable of properly addressing this question. I am referring, of course, to eye tracking.

By examining the visual behavior of a sample of targeted consumers viewing any media (TV, print, handheld or online) it is possible to determine which ads catch the eye and reach the brain. Over the past decade, eye tracking technology has come a long way. The hardware is totally unobtrusive, allowing a natural interaction with the test materials. The software is capable of monitoring every subtle shift of the eye to determine how quickly the ad is noticed, which elements are seen and how long attention is held before it flutters off toward something else. Most impressively, new developments in our cognitive processing research allow us to analyze the extent to which consumers are mentally engaged with the advertisement that they are viewing. In other words, you learn not only when/how/if the consumer looks at the advertisement, you also learn whether or not it leaves an impression.

But why not just ask people if they saw the ad? Why make your study more complex than it needs to be? We hear such questions from time to time. The knock on eye tracking in advertising research has traditionally been that it’s an overcomplicated solution. On the contrary, we would argue that in an age of information overload it is the world that is overcomplicated, not the solution. If anything, eye tracking helps to alleviate the congestion. It takes the endless stream of convoluted perceptual data that we encounter on a daily basis and uses it to answer a simple question with accuracy and objectivity: What gets through the filter?

Featured image from Unsplash.
What Gets Lost in the Heat Map

Eye tracking heatmap

If you perform a Google image search for ‘eye tracking,’ your results will consist primarily of heat maps – heat maps of webpages, heat maps of advertisements, heat maps of grocery store shelves, heat maps, heat maps and more heat maps. They are the most recognizable eye tracking analysis tool. They are the most commonly requested eye tracking deliverable. At this point, it isn’t too much of a stretch to say that the heat map has become the logo for the eye tracking industry as a whole.

However, this post will not be another puff piece about the unmitigated value of this oft-used data rendering. EyeTracking, Inc. will toot its own horn just this once to say that we were the originators of the heat map (or GazeSpot as we call it) back in the 1990s, and then we will proceed to a more objective discussion. What we’d like to talk about today is the manner in which these graphics are misused and misinterpreted. In doing so, we hope to shed some light on what gets lost in the heat map.

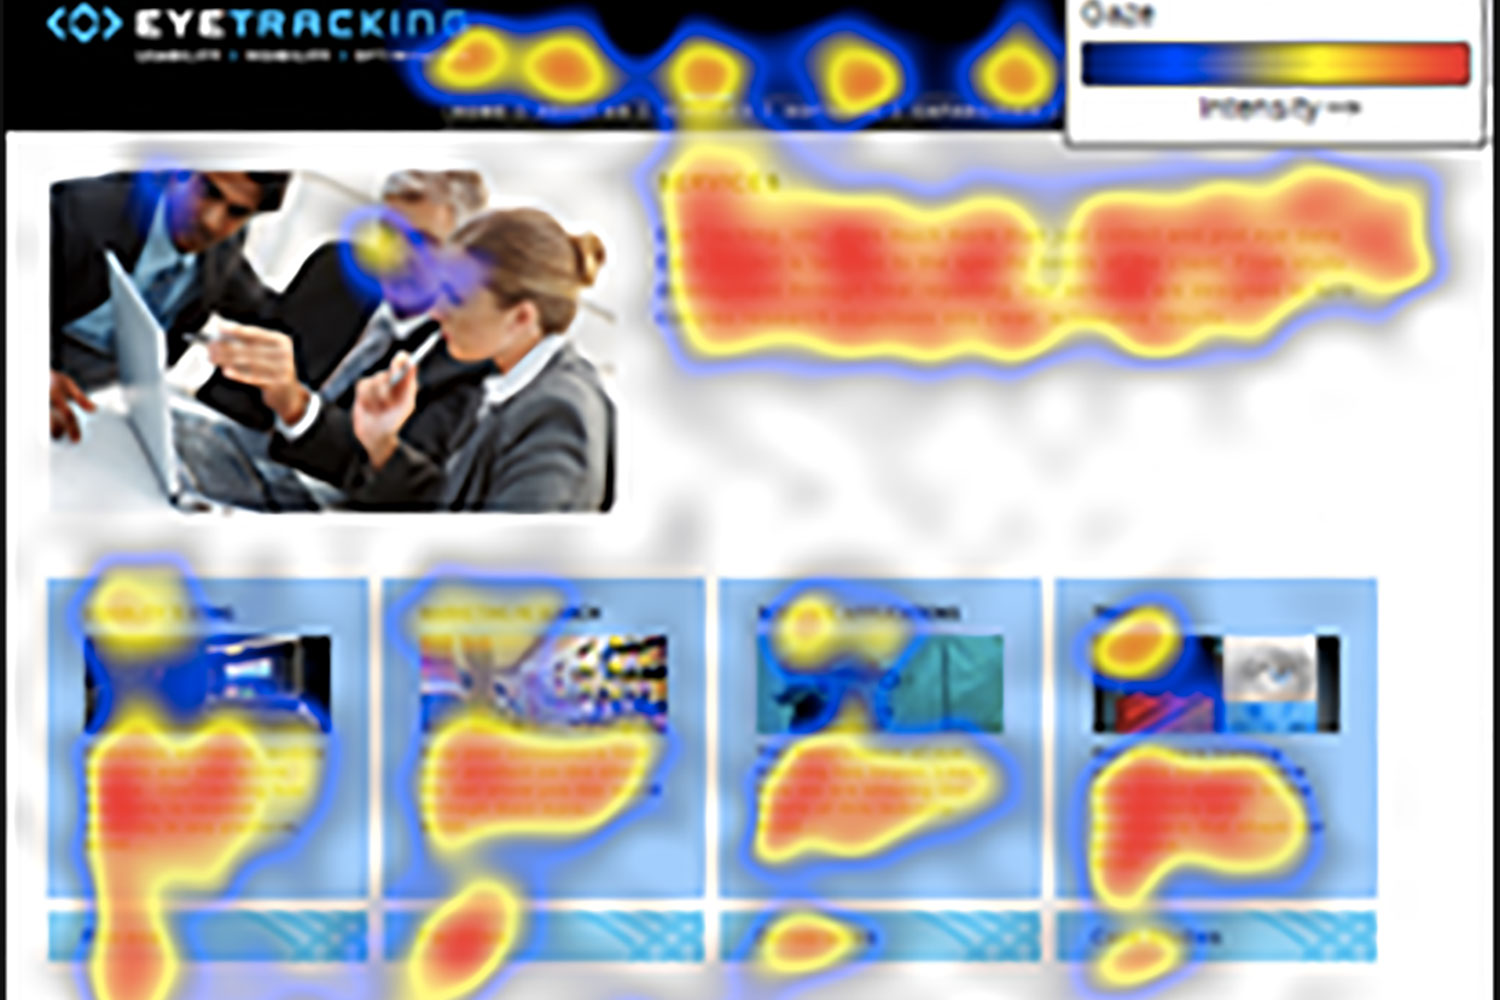
Take a look at the example on the right. This GazeSpot shows the aggregated visual behavior of ten users interacting with the Services page of eyetracking.com. Over 7,000 data points are represented here, and yet it doesn’t tell the whole story. Where is the eye drawn first? Is there a pattern in the way users move between elements of the page? How long do they stay here before clicking away? What usability problems are encountered? Did one user’s atypical viewing habits unduly influence the rendering as a whole? No matter what you may have heard, none of these important questions can be answered by the heat map alone.

And what about the pictures in our example? One of the most common misinterpretations of heat maps is the assumption that a particular non-text element was not viewed because it does not have an associated hot spot. Actually, the pictures on the page shown here were all viewed by all users. The reason that they don’t show up as hot spots is that it takes much longer to read a paragraph than it does to view an image. Thus, the impact of each user’s glance toward the picture grows more diluted with each second spent reading the text. As you can see, interpretation is not always as straightforward as it seems.     

This is not to say that the heat map has no value. In fact, we use them quite often in all kinds of different studies – websites, packages, advertisements, applied science and more. They are both elegant and intuitive as a means of demonstrating the total amount of attention allocated to specific features of a medium. However, attempts to apply them to deeper research questions are misguided. Any expert in the analysis of eye data will tell you that heat maps serve a precise purpose, one that should not be stretched too far.

In our experience, there is no graphic deliverable that really tells the whole story of visual behavior. That’s why we use a range of different ones – GazeTraces, GazeStats, GazeClips, Bee Swarms, GazeSpots and Dynamic GazeSpots (which are video heat maps with the added dimension of time). All of these deliverables are integrated with statistical analysis of the data, as well as traditional marketing research and usability measures to fully describe the interaction with our test materials. That’s the approach that we recommend for any comprehensive eye tracking study – use all of the tools at your disposal. While there are many fascinating results to be found in a heat map, if you aren’t careful how you use it, you might just get more lost.